Sunshine & Temperature

Exploring the relationship between incoming solar radiation and surface air temperature.

Measuring solar radiation
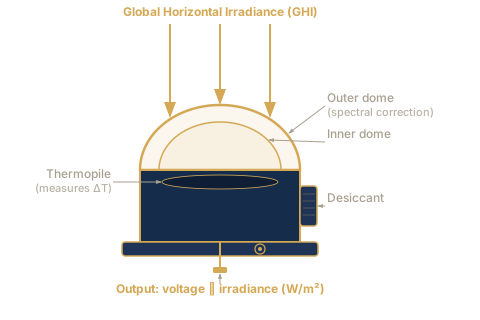
Cross-section diagram of a thermopile pyranometer showing outer and inner glass domes, thermopile absorber disk, desiccant cartridge, instrument body, and voltage output

A pyranometer measures the total solar energy arriving at the Earth's surface from all directions — a quantity called global horizontal irradiance (GHI) — by letting sunlight heat a black absorber disk under a glass dome and reading the resulting voltage.

What exactly is global horizontal irradiance?

GHI is the sum of direct sunlight and diffuse skylight falling on a flat, horizontal surface. It is measured in watts per square metre (W/m²) at any instant, and accumulated into megajoules per square metre (MJ/m²) over a day or month. It is the single most useful quantity for characterising how much solar energy a location receives.

Why two glass domes?

The inner dome blocks long-wave thermal radiation emitted by the outer dome itself, so only shortwave solar radiation reaches the absorber. The outer dome shields the inner dome from wind, rain and direct convective cooling. Together they make the instrument's response depend almost entirely on incoming sunlight rather than on wind speed or ambient temperature.

How does the thermopile work?

A thermopile is a stack of thermocouple junctions — pairs of dissimilar metals that generate a small voltage whenever the two junctions are at different temperatures. The black absorber disk heats up in sunlight while the instrument body stays cooler; the temperature difference drives a voltage that is calibrated against a reference standard and expressed directly in W/m².

What is the desiccant for?

Moisture inside the sealed dome space would condense on the inner surface and scatter or absorb some of the incoming light, creating a reading error. A small desiccant cartridge — visible as the ribbed cylinder on the side of the instrument body — absorbs water vapour to keep the dome interior dry.

What units are used here?

Instantaneous readings are in W/m². This lab shows the daily total in MJ/m² (megajoules per square metre), obtained by integrating the instantaneous reading over each day. Monthly and annual values in the charts are the mean of the available daily totals for that period. 1 MJ/m²/day ≈ 0.278 kWh/m²/day.

A global measurement network

Active pyranometer stations, 1893–present

Loading…

From a single instrument in Stockholm in 1893, the global network has grown to over 500 active stations today — hover the dashed milestone lines to read key events.

Why the spike around 1977–1980?

The sharp rise to around 100 stations in the late 1970s was driven by two large US-funded field campaigns: NOAA's Regional Energy/Climate Studies programme and the WEST Associates solar resource surveys, which temporarily deployed dense networks of pyranometers across the American Southwest and Great Plains to assess solar energy potential. Most of these campaign stations were decommissioned once the surveys ended, which explains the sharp drop back down in the early 1980s.

What is the BSRN?

The Baseline Surface Radiation Network, established in 1992 by the World Climate Research Programme, operates around 60 stations with tightly standardised instruments, calibration schedules, and data-quality procedures. BSRN stations report at 1-minute resolution and are considered the global reference for surface radiation measurements. The steady growth from the early 1990s onward largely reflects BSRN expansion and the formalisation of national radiation networks to BSRN standards.

Why does the count start with just one station?

Knut Ångström made the first systematic solar radiation measurements in Stockholm from 1893 using an instrument of his own design — the Ångström pyrheliometer. Routine monitoring elsewhere only followed once international instrument standards were established, first by the International Pyrheliometric Scale (IPS) in 1924 and later refined by the World Radiometric Reference (WRR) in 1979. The early count reflects only stations with confirmed, uninterrupted measurement records that survive in modern catalogs.

Are all stations measuring the same thing?

All stations shown measure global horizontal irradiance (GHI) — total downwelling shortwave radiation on a horizontal surface. Instrument types vary (thermopile pyranometers, silicon-cell sensors, rotating shadowband radiometers) and calibration standards have changed over time, which is one reason long-term consistency requires careful quality control. The WRR, maintained by the Physical Meteorological Observatory Davos (PMOD/WRC) in Switzerland, is the current international reference against which all pyranometers are calibrated.

Explore the data

Select one of the longest-running measurement locations. For each, compare incoming shortwave radiation against the raw (unadjusted) and homogenised temperature records from the nearest GHCN station.

Stations are shown in a random order to avoid nudging your choice.

Select a station above to explore the data.

Data sources & methodology
Temperature — GHCN-Monthly v4
Global Historical Climatology Network Monthly (GHCNm v4) dataset, served via klymot.com. Raw and Adjusted (homogenised) records. Menne et al., 2018.
Homogenisation
Adjusted records use pairwise homogeneity methods for non-climatic shifts. Menne & Williams, 2009.
Shortwave radiation — real pyranometer data (POT, DBL, STO)
Daily totals of global horizontal irradiance (GHI, MJ/m²/day) from national meteorological services: Potsdam from the DWD Climate Data Centre (FG_STRAHL, measured from 1947); De Bilt from the KNMI daggegevens API (Q variable, from July 1957); Stockholm from SMHI open data (hourly W/m² aggregated to daily MJ/m², from 1983). All three are direct pyranometer measurements.
Shortwave radiation — gridded model data (DAV, TOK, UCL, VAL)
For Davos, Tokyo, Uccle, and Valentia, no freely accessible daily pyranometer measurement records were found. These four stations currently use the Open-Meteo Historical Weather API as a placeholder. Open-Meteo draws from ERA5 reanalysis and related gridded products rather than direct station measurements. Real instrument records will replace this when sources are identified.
Station network history
Cumulative station counts derived from the AssessingSolar/solarstations catalog on GitHub. Milestone events curated by hand.