Airless Body Thermal Model
How much of the Moon's temperature can be explained by nothing more than sunlight, conduction, and radiation — on a body with no atmosphere at all?
A bare, rotating body heated only by direct sunlight. Set the parameters, run it, and see what time-averaged surface temperature comes out.
- What sets the Moon's day-side and night-side temperatures.
- What rotation speed and thermal conductivity each do to the day–night difference.
- Whether this simple physics reproduces NASA's actual measurements.
What this is actually computing
Heat flows vertically into the ground and north-south between latitudes. East-west flow is ignored: lunar regolith conducts too poorly for neighboring longitudes to exchange much heat in a single day. One simulated column per latitude, stepped through time, reconstructs every longitude by rotational symmetry.
This is intentionally a "surface physics only" model — no internal heat from the Moon itself, so the result depends only on sunlight, conduction, and radiation. Nothing in it is tuned to the Moon: it is a general heat-transfer model, and "the Moon" here is one particular choice of material, size, spin, and sunlight.
One more simplification: the Moon here orbits the Sun on its own, not the Earth. That means no eclipses, no earthshine, and seasons that follow a simple ~365-day year from its 1.54° tilt — rather than the real Moon's slightly shorter, Earth-coupled seasonal cycle (more under "Why does the Sun's angle in the sky matter" below).
Curious how it actually works? — ten short deep-dives
Optional. You can also just scroll on and play — these stay here if a result makes you curious later, and the rest of the page points back to them by name.
How does the model actually work?
Picture the Moon sliced like a loaf of bread, one column running straight down from the surface to the very centre. That column is chopped into a stack of boxes — thin ones near the surface, fatter ones deeper down. Each box is treated as one uniform blob: one temperature, one composition, no structure of its own.
Every box only ever talks to its immediate neighbours — mainly the box above and the box below it, plus a far weaker sideways exchange with the neighbouring latitude's box at the same depth (the north–south flow mentioned above). It gains or loses heat by conduction to and from those neighbours — and, only at the very top of the stack, gains heat from sunlight by day and loses heat to space as thermal radiation, day and night.
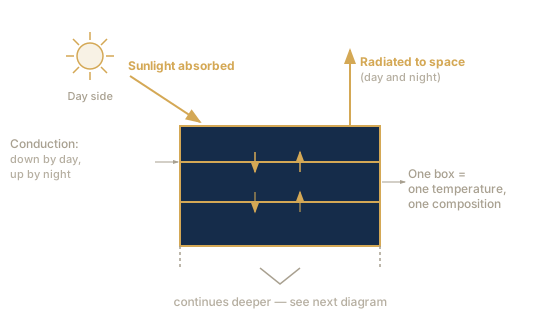
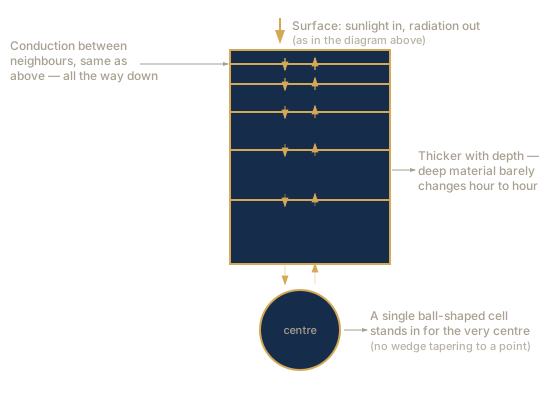
Zoom out and the same rule applies all the way down, box after box, growing thicker with depth, until a single ball-shaped cell at the very centre stands in for the whole core (see "More on the numerical scheme" below for why).
None of this happens in one leap. The simulation advances in small steps of time — a few simulated minutes at once — and at each step works out, for every box, how much heat it gained or lost since the last step, then nudges that box's temperature by the resulting amount before moving on. Thousands of these small steps, one after another, is what turns "boxes exchanging heat with their neighbours" into a full day/night cycle — and enough repeated cycles is what settles into the steady state plotted throughout this page.
Parameters
Everything below defaults to the Moon's real values as best currently sourced. Change anything and the comparison later will tell you exactly what you changed.
Choose one of the two conductivity models below. Their order is random so neither is presented as the default. (The third option is exactly what it looks like.)
Click to run the simulation and continue.
Watch it run
The globe is reconstructed from the single simulated column — every longitude is that column's own history, time-shifted by rotation. The Sun's size is illustrative, not to scale.
Surface temperature; the colour scale runs 60–400 K, passing through near-white at 230 K.
Settling in: many rotations
The coldest point reached during each rotation, for three representative latitudes — the equator, mid-latitude (≈48°), and near-pole (≈84°) — the grid's nearest band centres to 0°, 45°, and 80°. Of everything the run computes, this is the slowest quantity to settle, which is why it is the one plotted. Two things can show in these curves: the one-way settling itself, and — mainly at higher latitudes — a slow ripple that is the body's 1.54° tilt carrying its seasons across the run, not a numerical wobble. A curve still drifting when the run ends hasn't fully settled; the equatorial curve is the one compared against NASA data below. (Temperatures here and throughout are in kelvin: 273 K is 0 °C, and one kelvin step equals one degree Celsius.)
The diurnal cycle itself
The same three latitudes, scrolling forward one rotation period at a time as the simulation runs. The x-axis is total simulated time since the run began; the window slides forward as rotations accumulate.
Shaded bands: warm tint marks local day; the darker, cooler tint marks local night.
How close did it get?
See how it stacks up against NASA's actual measured lunar temperatures.
Enables once the simulation finishes.
Compare to NASA's measured lunar temperatures
Read this before drawing conclusions from the number below. This is a deliberately simplified model, also built to run smoothly on a phone in a browser tab — real effects like surface roughness, a mixed rock-and-dust surface, and sunlight being absorbed (and heat radiated) over a small but finite depth of loose regolith rather than exactly at the surface are left out entirely. Those omissions don't necessarily cancel out against each other, but sometimes they do — worth keeping in mind if a run lands unusually close to the measured curve below. As a rough guide, about 5 K is the finest difference this comparison can meaningfully resolve; landing much closer than that isn't evidence of a more precise result — it is just as likely a few simplifications happening to offset one another.
Two things about the reference curve itself are also worth knowing. First, it is a fit to brightness temperatures — temperatures inferred from the infrared the surface emits — measured by Diviner, an infrared instrument on NASA's Lunar Reconnaissance Orbiter, while the model reports the surface's kinetic temperature. For a surface that radiates slightly less efficiently than a perfect emitter (as this model assumes), the two conventions differ by about 1.3% — roughly 5 K at daytime-peak temperatures — and this comparison applies no adjustment for it. Second, the reference curve's step of a few tens of kelvins right at sunrise is a known artifact of how the published fit is constructed — its daytime and nighttime formulas meet imperfectly at that boundary — not a measured feature of the Moon.
What this tool is better suited for is comparing two runs against each other, not reading either one in isolation. A few things worth trying yourself — expand each for how to set it up, not what you'll find:
See data sources & methodology below for the papers behind the reference curve and both conductivity models.
Shaded bands: warm tint marks local day; the darker, cooler tint marks local night.
If you change a parameter and run another simulation, a table of all your runs' results will be kept here so you can compare them.
Your runs so far
Every simulation you run is added here so you can compare without remembering. Values in bold differ from the Moon defaults. Cleared if you reload or reset the lab.
| # | Run settings | Mean (equator) | Mean (global) | Diviner-fit mean (equator) | Difference (model − NASA) | Hottest (equator) | Coldest (equator) |
|---|